~/conor-linkston

Open to 2027 summer internships

Mathematics, Statistics & Finance · University of Strathclyde

I test whether the clever answer beats the simple one, and say so when it doesn't.

1stof 66 · 24h M&A challenge
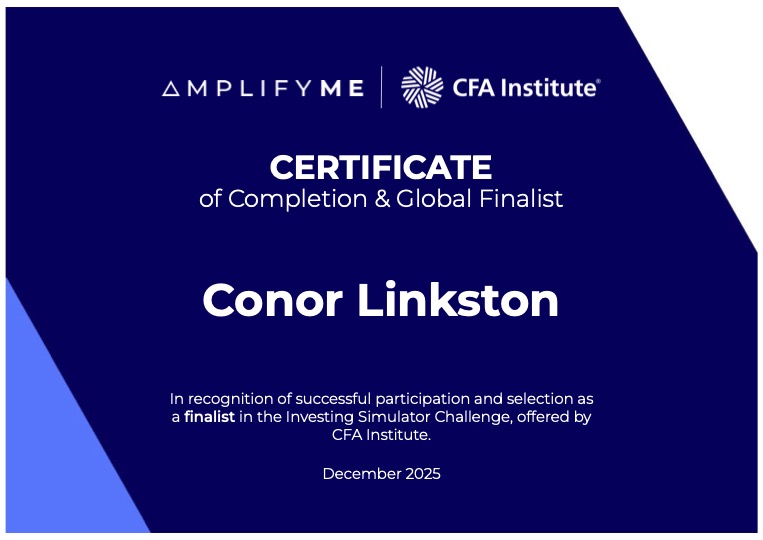
top 10%CFA Institute global finalist
97%Maths & Stats Computing
>10×my P&L vs 4th place · trading sim
  • HEDGE FUND SIM 1st / 65
  • 24H M&A CHALLENGE 1st / 66
  • SALES & TRADING SIM 3rd / 67
  • CFA INSTITUTE CHALLENGE Global finalist top 10%
  • MATHS & STATS COMPUTING 97%
  • 1/N vs RESAMPLED Sharpe 0.643 / 0.636
  • NKE BUY ▲ $55 target
  • BEST STOCK PITCH AmplifyME cohort
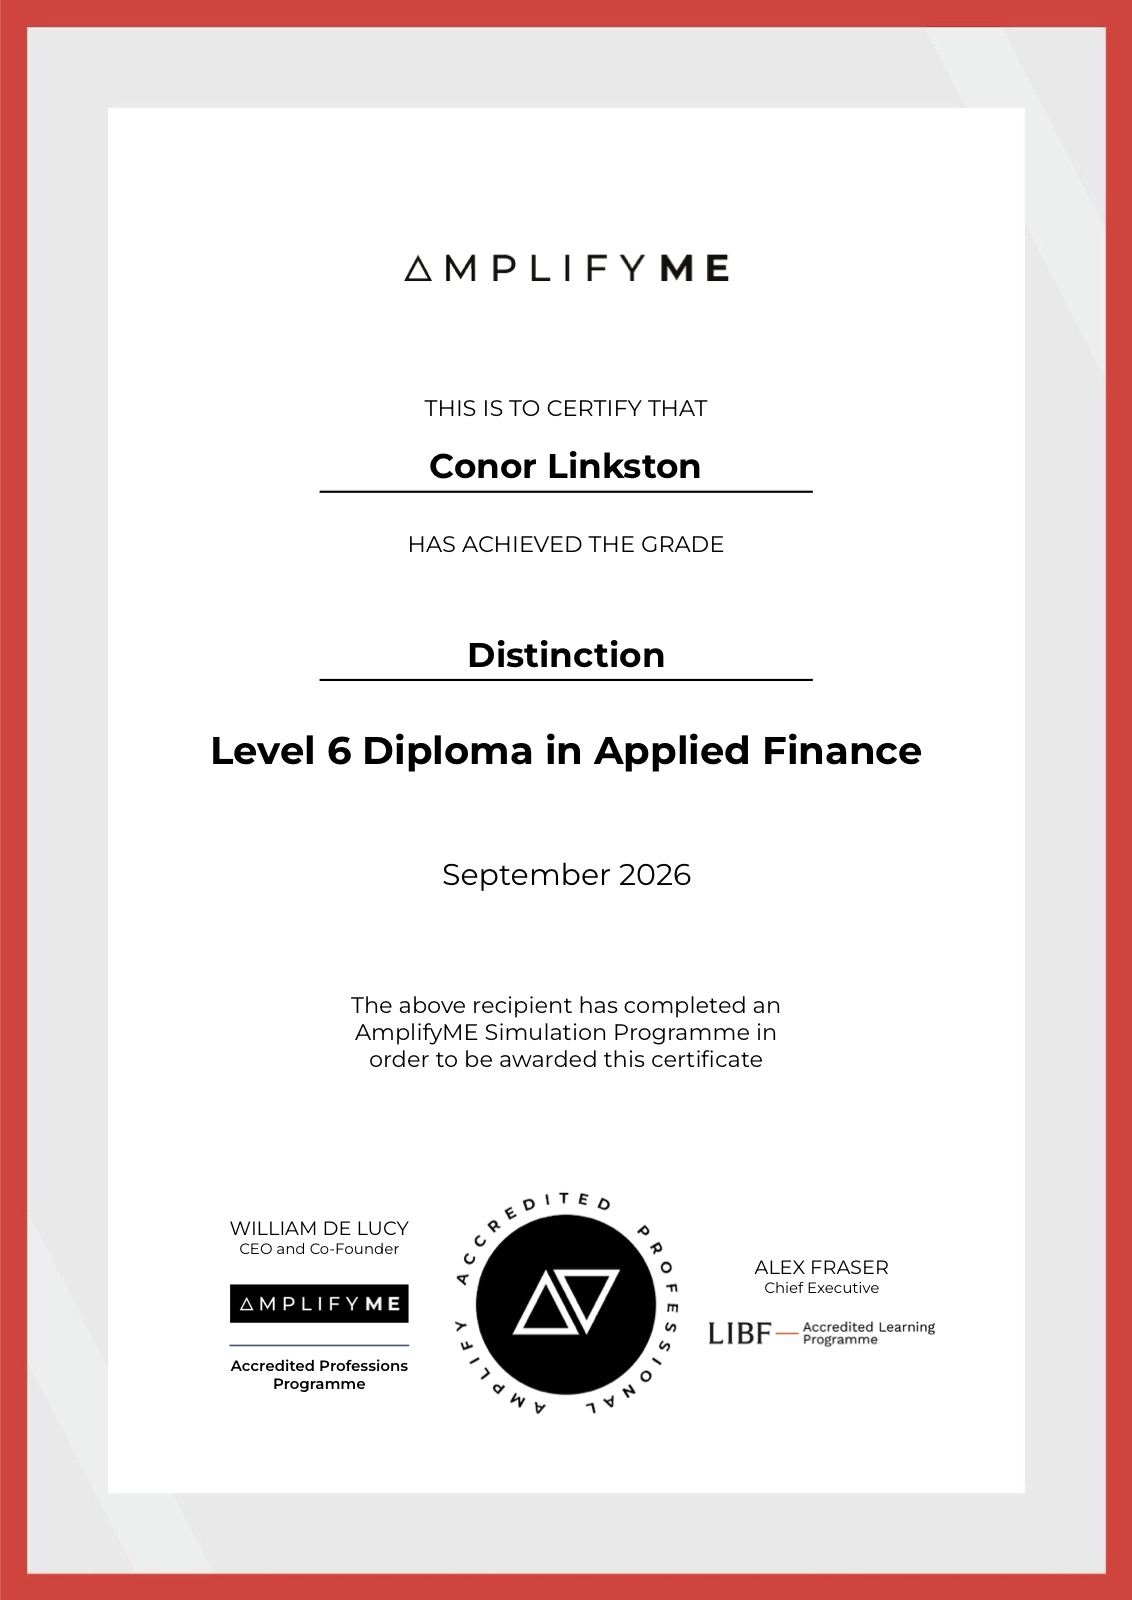
  • LIBF LEVEL 6 DIPLOMA Distinction

00 how i work

I study maths, stats and finance, and I build things on the side to learn the parts a module doesn't get to. Three habits run through all of it.

01

Always benchmark

A result means nothing without something simple next to it. Every strategy I test goes up against equal weight, and if the clever one loses, that is the finding.

02

Say what a metric measures first

I learned this one the hard way at Balfour Beatty (more below). Before I put a number in front of someone I check that it's actually comparing like with like.

03

AI as a tool, not a worker

I use AI agents to write a lot of code, and I hold myself to being able to defend every line of it. I write down what I corrected, what I rejected and where I went elsewhere.

01 work

Selected work

Two code projects, an equity pitch and an M&A case. The charts are built from my own outputs, so hover over them for the numbers.

Python · pandas · NumPy · SciPy · pytest 2026 Phase 1 complete

Robust Portfolio Optimisation Engine

Mean-variance optimisation is an error maximiser. It takes noisy estimates, trusts them completely, and bets heavily on whatever looked best last year. I built a walk-forward backtester to measure how much that actually costs, then tested two of the textbook fixes against each other on identical inputs. It grew out of my second-year essay on Michaud's resampled efficiency as an answer to Markowitz.

Universe
7 ETFs · equity, bonds, gold, property
Period
2005–2026 · 5,430 days
Lookback
252 days
Rebalance
monthly
Costs
10 bps turnover
Evaluation
walk-forward, out of sample
  1. Price datadata/
  2. Estimate inputsestimation/
  3. Choose weightsoptimisation/
  4. Backtest honestlybacktest/
  5. Compare to benchmarkbenchmarks/
  6. AI market viewsphase 3

Markowitz loses to equal weight, and not narrowly. It earns less while taking more risk: 18.4% volatility against 13.1%. That's the opposite of what a method built to optimise risk is supposed to do. It also traded 349% a year to get there.

Out of sample, net of costs · reproduce with python3 scripts/run_backtest.py
strategyann. returnann. volSharpemax DDturnover
Equal weight (1/N)7.86%13.10%0.643−36.7%2.4%
Markowitz (λ=3)7.44%18.36%0.483−31.7%349%
Markowitz + Ledoit-Wolf7.44%18.36%0.483−31.6%348%
Markowitz + resampling8.28%14.07%0.636−29.5%220%
Minimum variance3.67%5.35%0.700−19.7%30.4%
Minimum variance + LW3.59%5.32%0.689−19.8%29.9%

Why it loses

  1. It isn't diversifying.

    It holds 1.6 of 7 assets on average, with 85% in the biggest one. Every month it picks a favourite, piles in, and changes its mind the next month. That's not a portfolio, it's a sequence of bets.

  2. Costs aren't the cause.

    With costs switched off it still loses (0.502 vs 0.643). The decisions are bad, not just expensive.

  3. The expected returns carry no signal.

    In a typical window, not even the best-looking asset has a mean return distinguishable from zero (median largest |t| = 1.79, against 1.96). The covariance matrix is fine. The problem is μ.

Which fix worksassets held above 1% weight, of 7

    Shrinkage is a correct implementation of a tool aimed at a problem this project doesn't have. It chose a median intensity of 0.055 and changed nothing. Resampling goes after μ, and the optimiser goes from making one bet to holding a real portfolio.

    The risk-aversion sweepMarkowitz Sharpe by λ

    Not reporting the best row

    λ is the one number in the strategy I choose rather than estimate, so it's the easiest place to fit the model to its own test set. I fixed λ=3 from the literature before running anything, then published the whole curve instead of the best result.

    Performance improves the more the optimiser ignores its own return forecasts, steadily from λ=1 to λ=50. One lucky value would be suspicious. A trend across a 50-fold range is a property of the data, and it points to the same conclusion as the diagnostics.

    What I got wrong along the way

    • The off-by-oneOne character, :t against :t+1, separates a valid backtest from a fantasy. Nothing in the output would look wrong.
    • Forward-fill vs backfillffill() and bfill() are one character apart, and one of them is lookahead bias with no visible symptom. There's now a test for it.
    • A test that couldn't failMy first engine test passed because the rule meant to churn the portfolio never churned. Next time the test gets written before the engine.
    The dangerous errors here aren't the ones that crash. They're the ones that produce a plausible number. findings.md, §12

    Caveats, stated up front

    Resampling still doesn't beat 1/N. 0.636 against 0.643 is a tie at best, and 1/N gets there trading 2.4% a year instead of 220%. Minimum variance tops the Sharpe column by hiding 88% in bonds during an exceptional run for bonds. Next up: regime awareness (Phase 2), then LLM-generated views into Black-Litterman (Phase 3), evaluated out of sample like everything else. I've written my prediction for Phase 3 down in advance: it helps, but by less than resampling did.
    R · tidyverse · tidyquant · quadprog · SQL 2025 v2 in progress

    FTSE 100 Risk & Portfolio Analysis

    My first proper project, built in R to get ahead of a tidyverse module. Ten years of FTSE 100 data (2015–2025), twelve large caps, and two simple long-only portfolios measured against the index. I picked the period on purpose: it covers QE-era low rates, the COVID shock, and the 2022–24 rate hikes, because diversification that only works in calm markets isn't worth much.

    Min variance
    5.45%
    ann. return · 9.99% vol
    Equal weight
    1.95%
    ann. return · 11.75% vol
    FTSE 100
    1.95%
    ann. return · 12.22% vol
    Sharpe (rf = 0)
    0.53
    vs 0.16 index · 0.16 EW
    Growth of £1, January 2015 to December 2024monthly log returns, compounded
    • Minimum variance
    • Equal weight
    • FTSE 100 index
    View as table
    monthmin varequal wtFTSE
    Where minimum variance put the moneylong-only weights

      What it found

      Minimum variance had lower volatility and shallower drawdowns than the index across every regime. It leaned into defensive, steady names like Unilever, LSEG and National Grid and dropped BP, BAT and Vodafone entirely.

      The more interesting result was the correlation structure. Stocks that looked diversified in calm markets moved together when COVID hit, which is exactly when diversification is supposed to help. The benefit disappeared when it was needed most.

      What I'd flag now, a year on

      The minimum variance weights were fitted on the full ten years and then scored on the same ten years. That's in-sample, so the chart above flatters it. Fixing exactly this problem is what the portfolio engine above is built around.

      The index is the ^FTSE price series, so it leaves out the dividends that the adjusted stock prices include. That makes the gap to the index look bigger than it really is.

      v2, currently on a branch, moves the pipeline into a SQLite database with a proper schema and adds an Excel Power Query version of the analysis.

      Equity research · valuation Aug 2026 AmplifyME Summer Analyst Programme

      Nike: just buy it

      A contrarian stock pitch, picked as the best in the cohort. I presented it to the full group and defended it under questioning, then led a breakout team that developed it further and placed 2nd.

      NKE · NYSE
      BUY
      prices as of 20 Aug 2026
      Price
      ~$40
      12-year low · −78% from 2021
      Target
      $55
      ~38% implied upside
      Basis
      21×
      FY27E EPS $2.57

      The thesis

      The market has taken a bad patch and priced it as permanent decline. Nike is earnings-depressed, not distressed.

      • Demand doesn't go away. Everyone needs footwear, and often. Nike is still the category leader across Nike, Jordan and Converse, and brand equity on that scale doesn't evaporate in two weak years.
      • Running is a tailwind. On and Hoka took share, but Nike still has the distribution, athletes and R&D to win it back.
      • Fashion moves fast. Sneaker culture comes in waves. One strong product cycle could bring it back faster than the market is pricing.
      • A self-help turnaround. Elliott Hill is resetting wholesale, clearing inventory and refocusing on sport-led product. That's the classic setup for margin recovery once comps normalise.

      Valuation

      At $40 Nike trades on 18.6× trailing earnings, half its ten-year average of 37×. The $55 target uses a deliberately conservative 21× on FY27 EPS of $2.57, still below its own history and assuming only a partial recovery. The street's consensus target of $50.66 suggests even cautious analysts think it's oversold, and a 4.2% dividend yield with 20+ years of increases pays you to wait.

      What would break it

      • The turnaround takes years. JPMorgan sees FY2028 as stabilisation, not growth.
      • China stays weak (revenue −17% currency-neutral in Q4).
      • Share lost to On and Hoka turns out to be structural.
      • More margin pressure from tariffs and discounting.

      A student pitch written for a training programme, not investment advice.

      Three-statement model · DCF · comps · sum of the parts · accretion/dilution Sep 2026 1st of 66

      Disney: worth more in pieces?

      AmplifyME's 24-hour M&A challenge. The brief was a full valuation of Disney, a test of whether a three-way break-up unlocks value, and a look at buying Electronic Arts. My model came 1st of 66: fastest to finish, with 100% on accuracy. The question underneath it all: is Disney worth more as three businesses than as one, and if the market is discounting it, is buying EA a better use of its shares?

      Share price
      $106.16
      12 May 2026
      Blended fair value
      $132.98
      DCF · EV/revenue · EV/EBITDA
      Break-up
      −$8.35
      per share, like for like
      EA deal
      −19.3%
      EPS dilution in year one
      1. The discount is real, but fragile.

        Weighting the DCF and both trading multiples equally puts fair value 20% above the share price. But using peer medians instead of a mean dragged up by Netflix, both multiples legs fall to $77 and $89. The DCF upside also needs beta to stay at 0.45, when it only breaks even at 0.92.

      2. The break-up case was comparing unlike numbers.

        The segment DCFs add up to $144.47 a share, which looks better than the $132.98 standalone. But that's an enterprise value, and the standalone figure is equity. Take off $19.84 of net debt per share and the parts are worth $124.63, so splitting up destroys $8.35 a share. It's the same check I learned at Balfour Beatty: know what a number measures before you compare it.

      3. EA doesn't pay for itself.

        At a 30% premium Disney would be paying 73.6× EA's earnings with shares valued at 14.1×. The modelled $500m of synergies is worth about $5.3bn, a third of the $15.1bn premium. Justifying the price would take $1.43bn a year, nearly three times the modelled figure. The debt side is fine (leverage goes from 1.90× to 2.35× against a 3.0× covenant). The problem is the price.

      The case materials belong to AmplifyME, so the deck isn't posted here. The figures above come from my own model.

      02 experience

      Experience

      1. Jul 2026Glasgow

        Finance Work Experience

        Balfour Beatty plc

        A placement I scoped directly with the Scotland Finance Director.

        • Built a counterparty credit assessment of five prospective subcontractors. I pulled data from their published accounts, calculated liquidity, leverage and profitability ratios (acid test, cash interest cover, gearing, ROCE, operating margin, net worth), combined them with Dun & Bradstreet data, and turned it all into scored comparative profiles for non-finance stakeholders. It fed into the final contractor selection.
        • Worked through the firm's IRR-based lease-versus-buy analysis, including staggering vehicle lease start dates to spread maintenance costs and smooth the P&L.
        • Covered infrastructure investment modelling at Balfour Beatty Investments, and how divisional reporting consolidates to group and eventually reaches the market.

        The bit I learned the hard way

        I'd colour-coded the Dun & Bradstreet ratings in my output before I understood that the code combines two separate measures, company size and credit risk, on a non-linear scale. A finance manager pointed out that my presentation made a large, riskier supplier look safer than a small, sound one.

        Since then I state what a metric measures before I present it, and I only use visual emphasis where the comparison is genuinely like-for-like.

      2. Aug – Sep 2026London

        Summer Analyst Training Course

        AmplifyME

        • Hedge fund sim R1 1st / 65
        • Hedge fund sim R2 2nd / 65
        • Sales & trading 3rd / 67
        • 24h M&A challenge 1st / 66
        • Stock pitch best in cohort
        • Placed 1st and 2nd across two hedge fund simulation rounds. In the sales and trading simulation, run as a market-making hedge fund, I came 3rd with a P&L more than ten times that of 4th place.
        • Came 1st for my valuation model in the 24-hour M&A challenge: fastest to finish, with 100% accuracy.
        • My Nike pitch (above) was picked as the strongest in the cohort.
      3. Oct 2023 – presentGlasgow

        Sales Assistant, Stock Processing and Deliveries

        TK Maxx

        • Key holder running weekend deliveries: opening the store at 06:00 and getting incoming stock onto the shop floor.
        • Reconciled delivery paperwork with drivers, checking £50,000–£100,000 of inbound stock against manifests and documenting equipment returns.
        • Trained new staff and supervised charity work experience placements. Three years of continuous work alongside full-time study, exam periods included.

      03 education

      Education

      Sep 2024 – Jun 2028Glasgow

      University of Strathclyde

      BSc (Hons) Mathematics, Statistics and Finance

      • Mathematical and Statistical Computing 97%
      • Economics and Business Analysis 74%
      • Essential Statistics 73%

      Year 3

      • Advanced Corporate Finance & Financial Markets
      • Treasury Management & Derivatives
      • Numerical Analysis
      • Applied Linear Algebra
      2018 – 2024West Lothian

      The James Young High School

      • Advanced Higher Mathematics B
      • Higher Mathematics A
      • Highers: Business Management, English, Physics, Biology B
      • National 5s 6 at A–B

      Why I pick side projects the way I do

      I build projects ahead of the modules they relate to. The FTSE project got me ahead of a tidyverse module, and the portfolio engine is built so statistical inference, stochastic processes and numerical analysis each have something to attach to this year.

      04 beyond the degree

      Beyond the degree

      Societies
      • Strathclyde Trading Society
      • Strathclyde Finance & Accounting Society
      Volunteering £260

      Raised on the Alzheimer's Society 26.2-mile hike.

      Volunteering £500+

      Raised playing in the Team Jak charity football match.

      Edinburgh Marathon · May 2026 42.2 km

      Trained for alongside full-time study, through semester and exams.

      Chess 1600

      Taught by my dad and still play regularly. I beat a 1600-rated engine, eventually, after a lot of attempts.

      05 record

      Awards & certifications

      Hover over a card or tap it to see the full certificate. Scroll the strip sideways or use the arrows.

      AmplifyME and CFA Institute certificate of completion and global finalist, Investing Simulator Challenge, awarded to Conor Linkston, December 2025
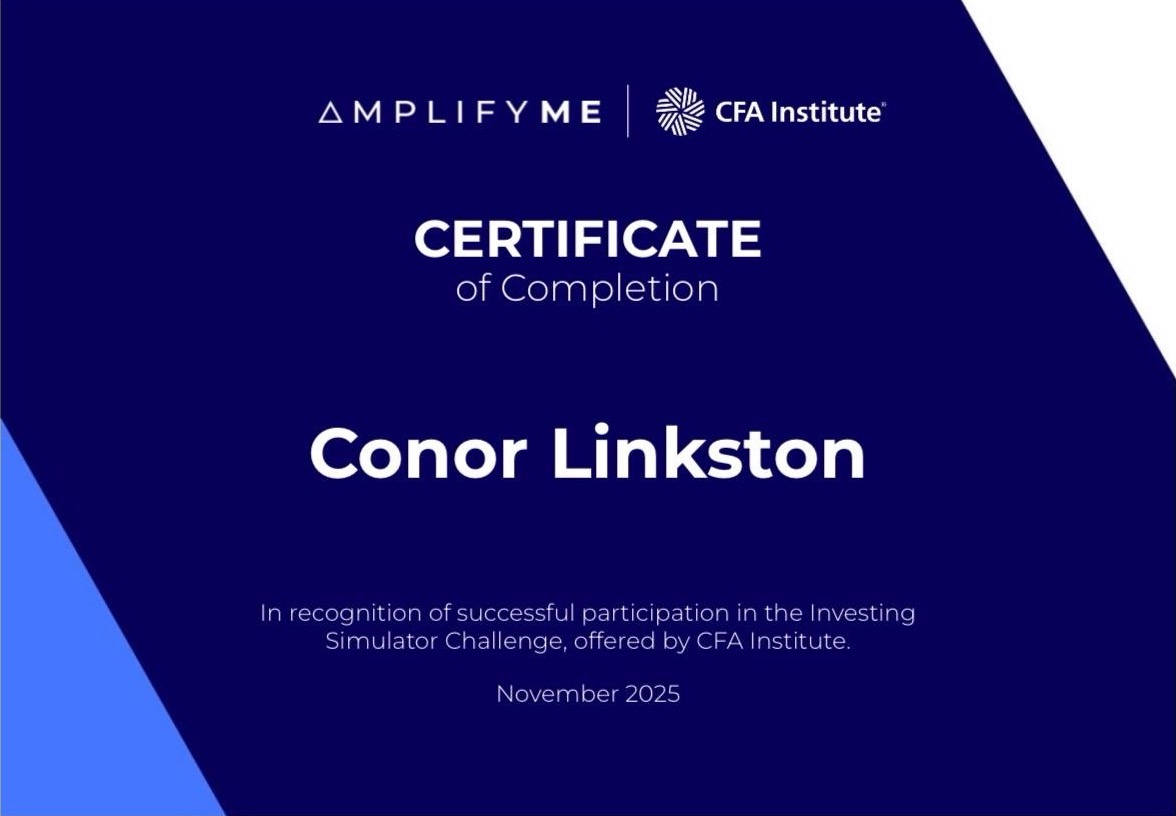
      AmplifyME and CFA Institute certificate of completion, Investing Simulator Challenge, awarded to Conor Linkston, November 2025
      AmplifyME certificate: Conor Linkston has achieved the grade Distinction, Level 6 Diploma in Applied Finance, September 2026, LIBF accredited learning programme
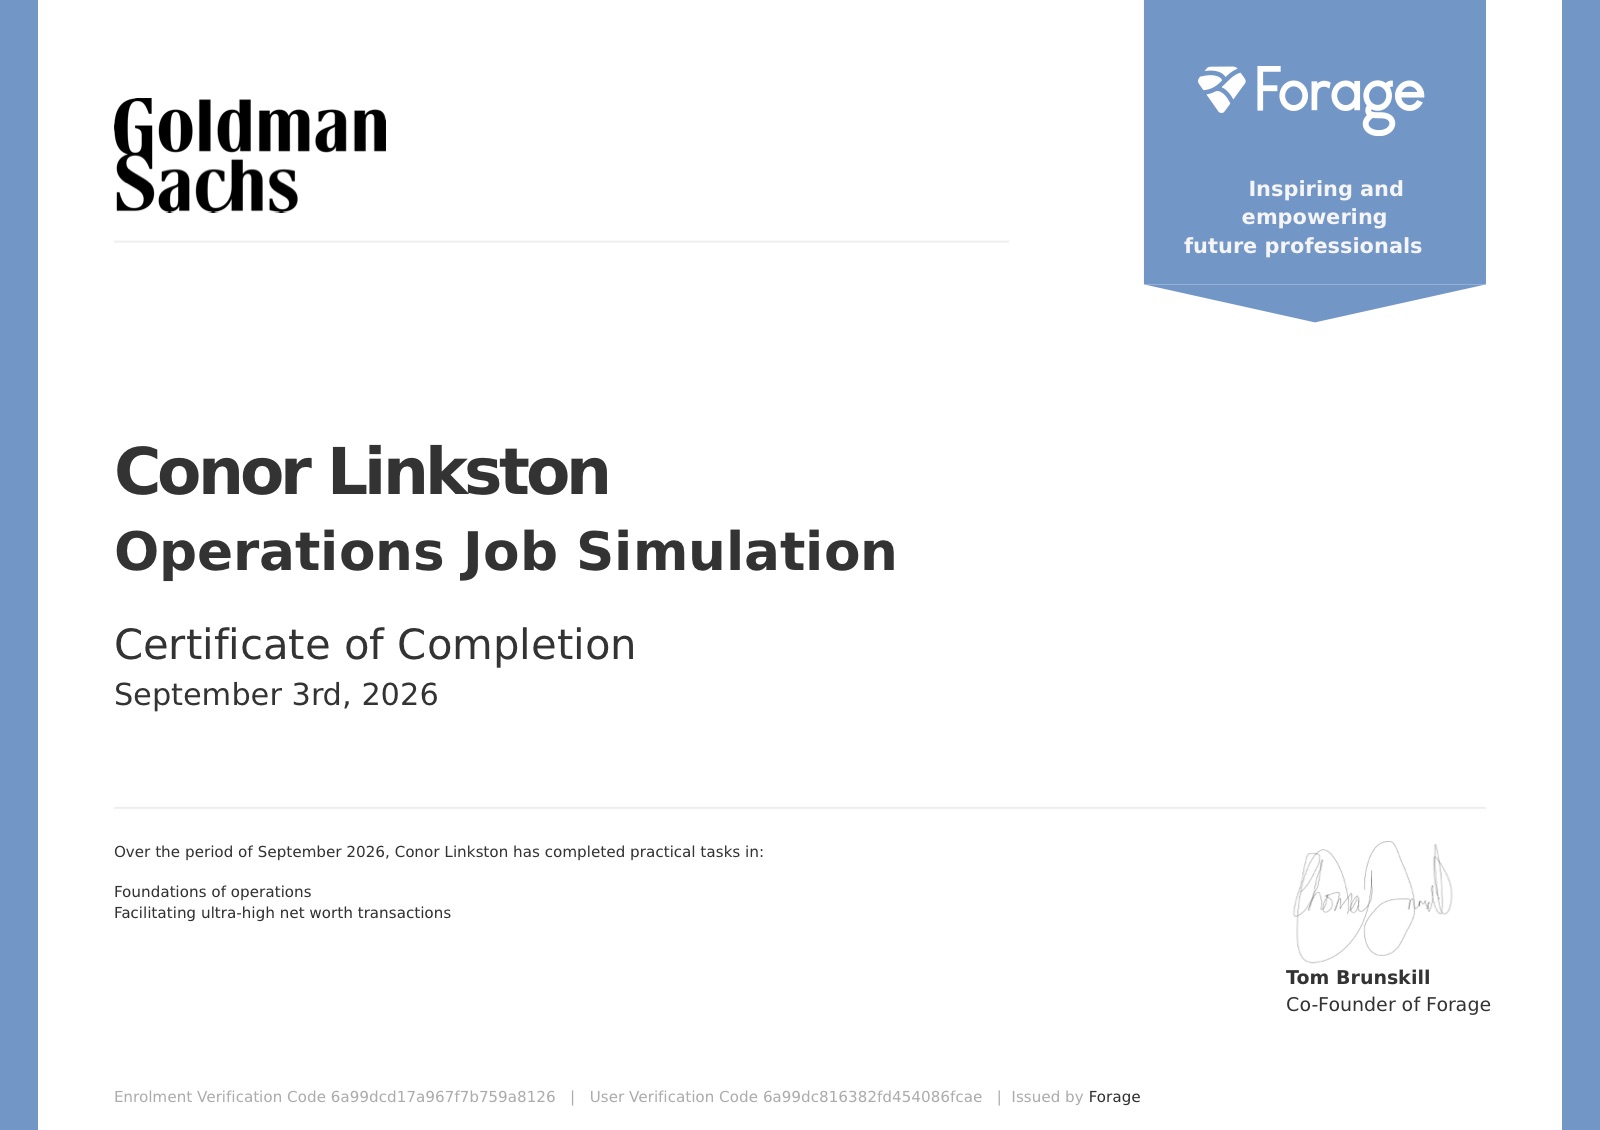
      Goldman Sachs Operations Job Simulation certificate of completion via Forage, awarded to Conor Linkston, 3 September 2026
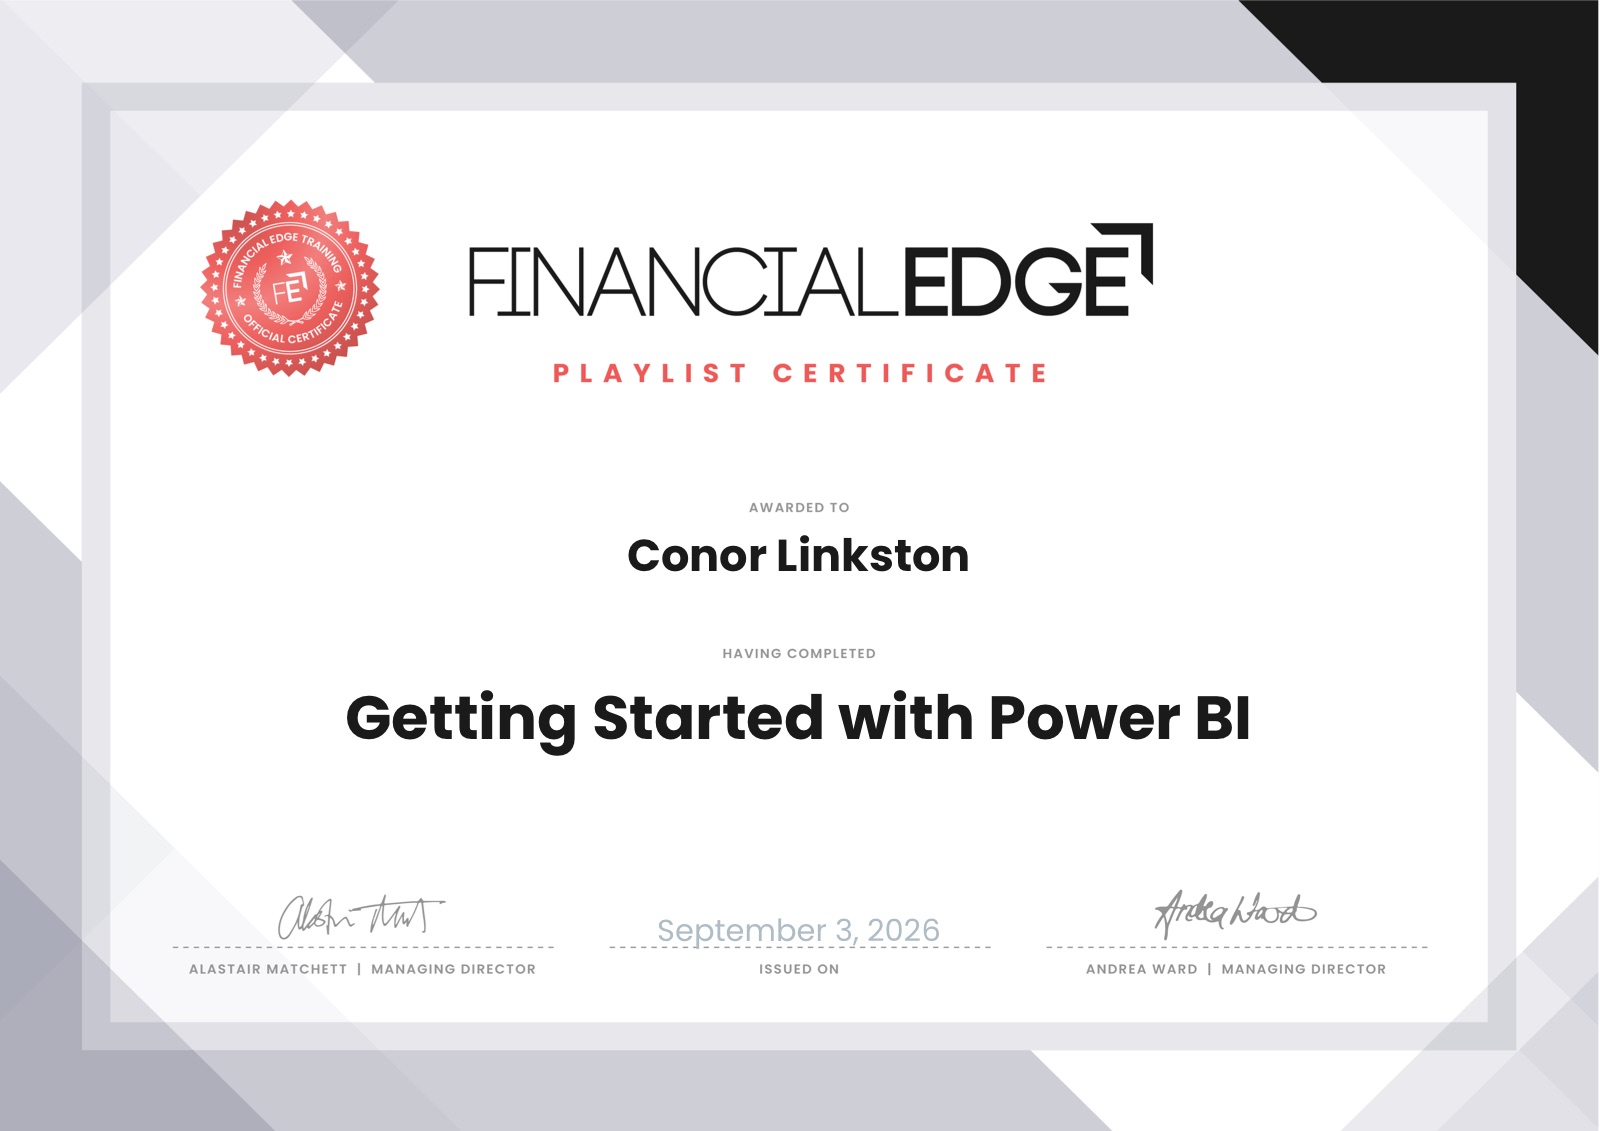
      Financial Edge playlist certificate, Getting Started with Power BI, awarded to Conor Linkston, 3 September 2026

      01 / 04

      Toolkit

      Languages
      Python (pandas, NumPy, SciPy, pytest) · R (tidyverse, tidyquant) · SQL · MATLAB
      Finance
      Ratio & credit analysis · DCF / multiples · IRR lease-vs-buy · portfolio construction · backtesting
      Tools
      Excel (Power Query) · Power BI · Git / GitHub · AI-assisted workflows

      07 contact

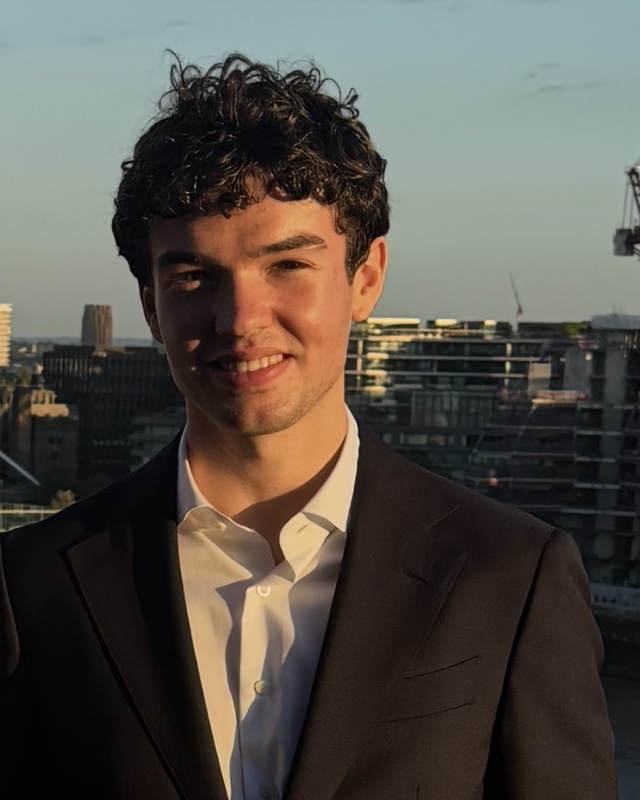
      Conor Linkston in a dark suit on a rooftop terrace in London at sunset
      London · September 2026

      Get in touch

      I'm looking for 2027 summer internships in finance. If something here is relevant to what your team does, I'd be glad to talk it through.

      conorlinkston@icloud.com